Menu
|
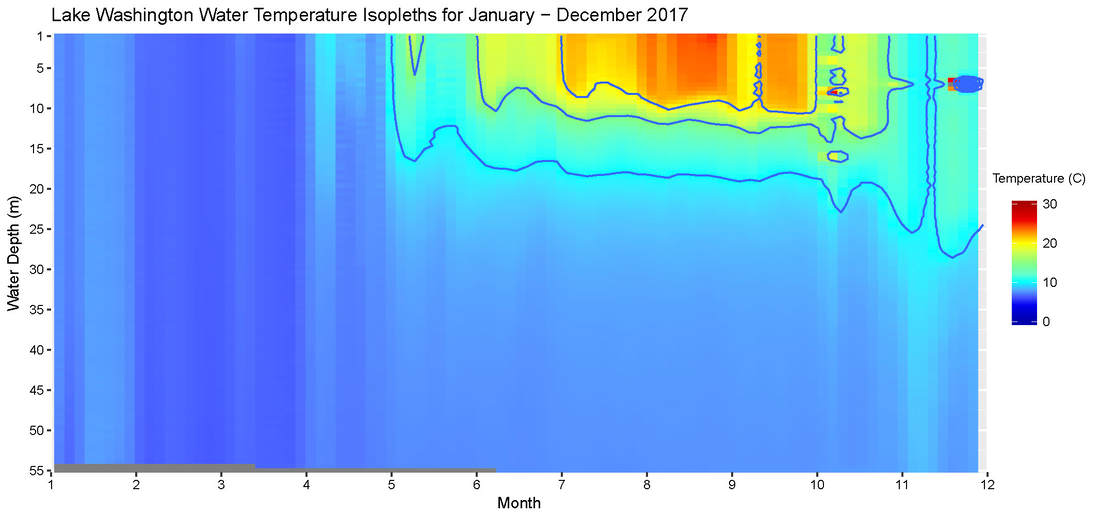
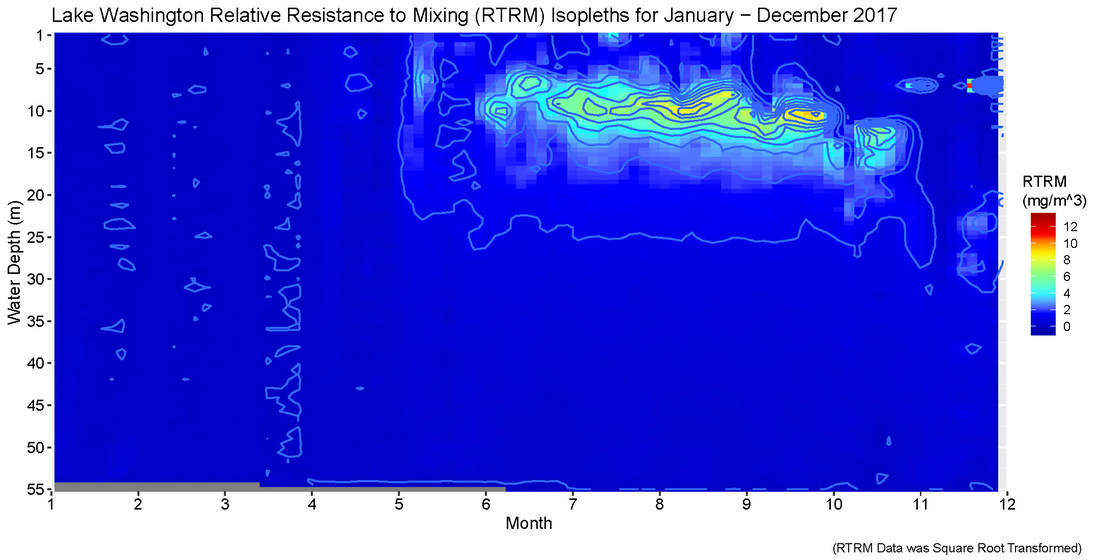
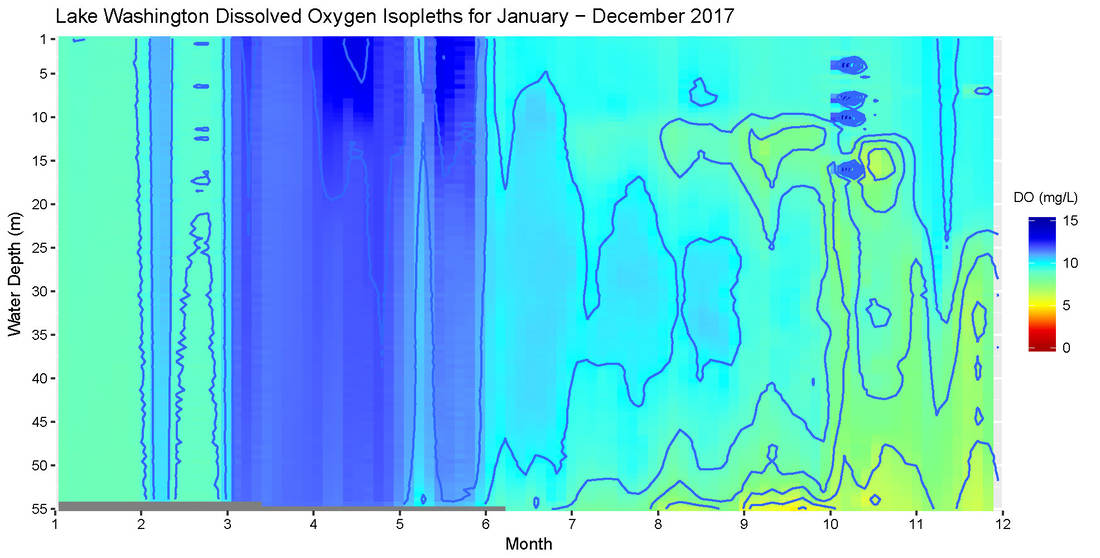
#https://github.com/EvanAquatic/Isopleths/blob/master/Isopleths%20Code%20R #Data used from Lake Washington, WA (Lake Washington. (2016, Februrary 26) Retrived October 23, 2018, from https://www.kingcounty.gov/services/environment/water-and-land/lakes/lakes-of-king-county/lake-washington.aspx) #You can use either a concatenate for %m.%d or use POSIXct for relying time series library(tidyverse) library(reshape2) library(colorRamps) library(scales) library(MBA) #Utilizing either Temperature.C or DO.Concentration.mg.L or #Utilizing either Temperature.C, DO.Concentration.mg.L or Relative.Resistence.to.Mixing.mg/m^3 mba<-mba.surf(Sample[,c('MonthDay', 'Depth..m.', 'Dissolved.Oxygen..mg.L.')], 100, 100) dimnames(mba$xyz.est$z) <- list(mba$xyz.est$x, mba$xyz.est$y) SampleMelt<-melt(mba$xyz.est$z, varnames = c('MonthDay', 'Depth..m.'), value.name = 'Dissolved.Oxygen..mg.L.) Fig <- ggplot(data=SampleMelt, aes(MonthDay, Depth..m.))+ geom_raster(aes(fill = Dissolved.Oxygen..mg.L.), interpolate = F, hjust = 0.5, vjust = 0.5) + geom_contour(aes(z = Dissolved.Oxygen..mg.L.)) + # geom_point(data = df3, aes(date, Sample.depth..m.), colour = 'white') + #scale_x_datetime( limits = c(as.POSIXct("2000-01-01"),as.POSIXct("2000-12-31")))+ scale_x_continuous(expand =c(0,0), limits = c(1,12), breaks=c(1,2,3,4,5,6,7,8,9,10,11,12))+ scale_y_reverse(expand = c(0, 0), breaks=c(0,1,5,10,15,20,25,30,35,40,45,50,55)) + scale_fill_gradientn(colours=rev(matlab.like2(7)),limits=c(0,15), breaks=c(0,2.5,5,7.5,10,12.5,15), name="DO (mg/L)")+ #scale_fill_gradientn(colours=matlab.like2(7),limits=c(0,30),breaks=c(0,5,10,15,20,25,30), name="Temperature (C)")+ #scale_fill_gradientn(colours=matlab.like2(7),limits=c(0,14),breaks=c(0,2,4,6,8,10,12,14), name="RTRM (mg/m^3")+ ## Since the palette is a vector use colours = rev(matlab.like2(7)) change to red2green2blue labs(title='Lake Washington (##Water Temperature, Dissolved Oxygen or RTRM) Isopleths for April - October 2018') + #subtitle="", tags="A", caption="()" xlab("Month")+ ylab("Water Depth (m)")+ theme(plot.title = element_text(color="#000000",family = "sans", size=14)) + theme(axis.title.x = element_text(colour = "#000000", family="sans",size=12))+ #windowsFonts() serif=TNR, sans=Arial, mono=Courier theme(axis.title.y = element_text(colour = "#000000", family="sans", size=12))+ #face="bold/plain/italic/bold.italic", color="#000000", size=# pts, angle=# (0,360) theme(axis.text.x = element_text(color="#000000", size=10.5, family="sans"))+ theme(axis.text.y = element_text(color="#000000", size=10.5, family="sans")) Fig ggsave(filename="~/##########.pdf", Fig, width=11, height=6.5)
0 Comments
|
Archives
February 2020
Categories |
||||||


 RSS Feed
