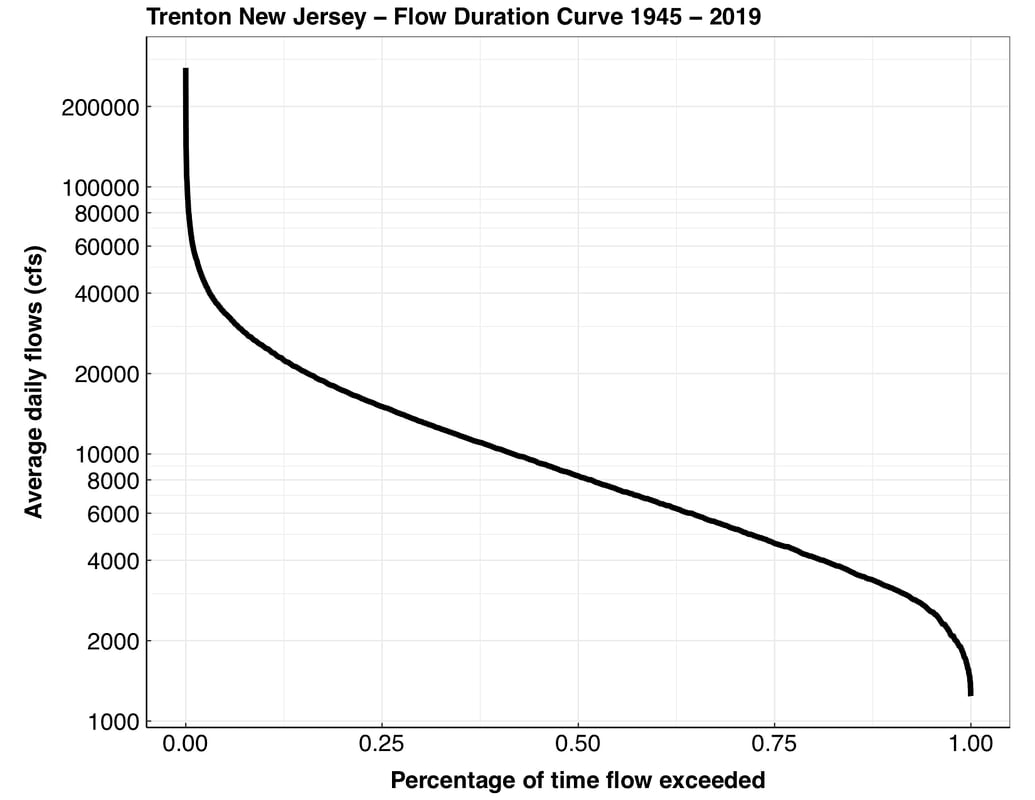
 A nice and simple flow duration curve figure that anyone can use for analyzing probability. These figures display discharge vs. percent of time that a particular discharge. This information can become particularly useful to show how frequent particular discharges may occur or exceed some percentage of time (e.g., 25% and 75%) The area under the curve dictates the average daily flow, while the median daily flow is at 50% in the case above over a 74 year period utilizing average daily flows. library(tidyverse) library(dataRetrieval) source('logtickmarks.r') #function for specifying logarithmic y-axis breaks options(scipen=999) #removing scientific notation TRENTONFlow <- readNWISdv(siteNumber='01463500',parameterCd=c("00060")) #Importing USGS average daily flow values for Trenton, NJ #Attached below is a specific function for outputting a logarithmic tick mark/grid. #Developing ggplot2 theme format themebox <- function(base_family = "sans", ...){ theme_bw(base_family = base_family, ...) + theme( plot.title = element_text(size = 18, face = "bold"), axis.ticks.length = unit(-0.05, "in"), axis.title = element_text(face="bold", size=18), axis.text.x=element_text(margin=unit(c(0.3,0.3,0.3,0.3), "cm"),colour="black", size = 18), axis.text.y=element_text(margin=unit(c(0.3,0.3,0.3,0.3), "cm"),colour="black", size = 18), axis.line = element_line(size=0.5, colour = "black"), #axis.ticks.x = element_blank(), aspect.ratio = .8, legend.background = element_rect(color = "black", fill = "white") ) } TRENTONFlow %>% mutate(my_rank = 1 - percent_rank(X_00060_00003)) %>% #transforming flow values into a ranked percentage mutate(my_rank = if_else(my_rank == 0.01, 1, my_rank)) %>% ggplot(aes(my_rank,X_00060_00003)) + geom_line(size=2) + ggtitle("Trenton New Jersey - Flow Duration Curve") + scale_y_log10(name = 'Predicted daily flows (cfs)', breaks = logTicks(n = 10), #1,2,4,10,100, etc. outline how many major base pair ticks marks minor_breaks = logTicks(n=100))+ #outline how many minor base pair ticks marks; keep in mind logarithmic scale_x_continuous(name = 'Percentage of time flow exceeded')+ themebox()
0 Comments
|
Archives
February 2020
Categories |
||
 RSS Feed

@ 2016 Evan Kwityn. All Rights Reserved